Chrome DevTools is a set of web developer tools built directly into the Google Chrome browser. they can help you edit pages on-the-fly and diagnose problems quickly, which ultimately helps you build better websites, faster.
Introduction
Through chrome devtools, you can enhance your website by addressing styling errors and assessing changes in real-time. Learn how to utilize Chrome DevTools to use this tool as a sandbox for experimenting with the website styles and code. You are not required to do any further configuration because Chrome DevTools are embedded inside your web browser. These developer tools are highly recommended since they assist you in editing the style of your website, completing DOM-related operations, debugging JavaScript, and improving website speed. Before we move towards the use of Chrome DevTools, we should understand somthing as follows:
- Web browsers execute Javascript, CSS and HTML. these are three languages that Chrome Devtools are intended to use.
- Anyone can munipulate the websites using Chrome DevTools. The applied modifications by devtools will be viewed and vanished as you refresh the web page. These devtools assist you in determing which changes are required. You will need to access the back-end code to make those changes permanent.
The reason using Chrome Devtools
By permitting users to edit website directly in the web browser. Chrome Devtools saves you time. To justify the statement, check out the below-given list of Chrome Devtools aspects that can help you improve you web development.
- Efficiency Chrome DevTools are embedded into your web browser, providing you the facility to edit websites or content without switching tabs.
- Panels Using Chrome DevTools, you can play around with various page elements and extract the information, but keep in mind that any modifications you make will be lost if you close your tab without storing them.
- Optimization You can also execute Audits through which you can get a report related to the performance. On the web browser, you will get suggestions on enhancing the site’s loading speed.
- Debug
The user can identify the errors by pausing your running website code and pinpointing the exact instant when the script fails to run correctly.
How to open Chrome DevTools
Chrome Developer Tools can be accessed using keyboard shortcuts:
- Press “CTRL+SHIFT+J” or “F12” to open Chrome DevTools on Windows, Chromebook, and Linux.
- For macOS, hit the “CMD+SHIFT+J” or “CMD+SHIF+C” shortcut.
Using Chrome’s menu: Explore “More Tools” > “Developer Tools” in the Chrome menu. It will lead you to the Chrome DevTools Window: 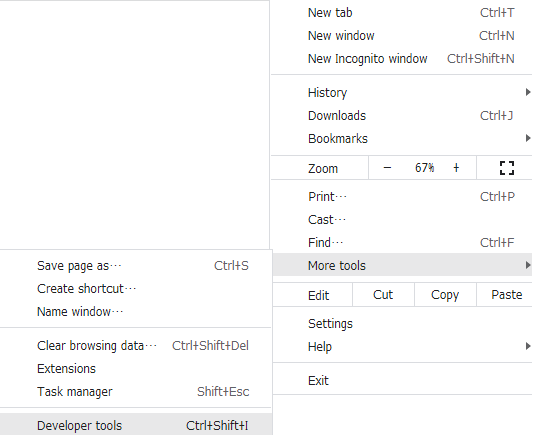
The Developer Tools window has three tabs at the top, plus a further six that you may see by clicking the » sign next to them: 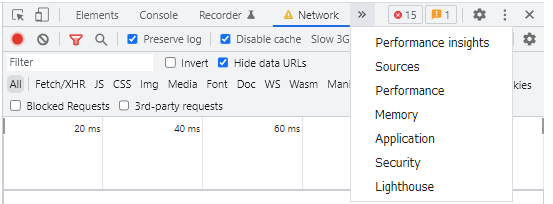
Here are the names of tab showing in our panel: 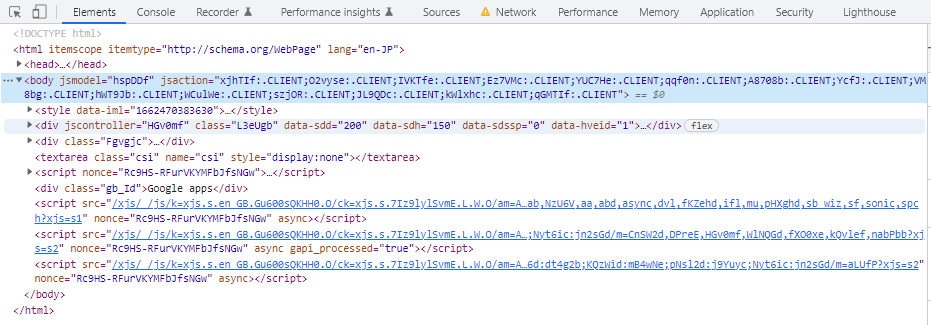
- Elements: Elements shows you the HTML used to build the page you’re looking at, together with any inline CSS.
- Console: Console deals with JavaScript. It gives you information about interactive elements on a page. In Console, you can write JavaScript to interact with the web page you’re viewing, and it also lets you write messages to yourself in the JavaScript of websites you’re building, which then show up in Console to show that the JS was executed.
- Sources: The Sources tab shows you where all the files that were used to make the website are stored and lets you inspect them.
- Network: The Network tab shows you all the files that are loading in the URL you’re looking at.
- Performance
- Memory
- Application: Application shows you what’s in your browser storage: in-browser databases like Web SQL, local storage, and more. It also gives you granular control over your cookies.
- Security: Security gives you basic security information, letting you view a site’s HTTPS certificate and TLS status.
- Lighthouse
HTTP Headers
The HTTP headers are used to pass additional information between the clients and the server through the request and response header. All the headers are case-insensitive, headers fields are separated by colon, key-value pairs in clear-text string format. The end of the header section denoted by an empty field header. There are a few header fields that can contain the comments. And a few headers can contain quality(q) key-value pairs that separated by an equal sign.
There are four kinds of headers context-wise:
- General Header: This type of headers applied on Request and Response headers both but with out affecting the database body.
- Request Header: This type of headers contains information about the fetched request by the client.
- Response Header: This type of headers contains the location of the source that has been requested by the client.
- Entity Header: This type of headers contains the information about the body of the resources like MIME type, Content-length.